S280 Science Matters
"Changing Climate"
Summaries
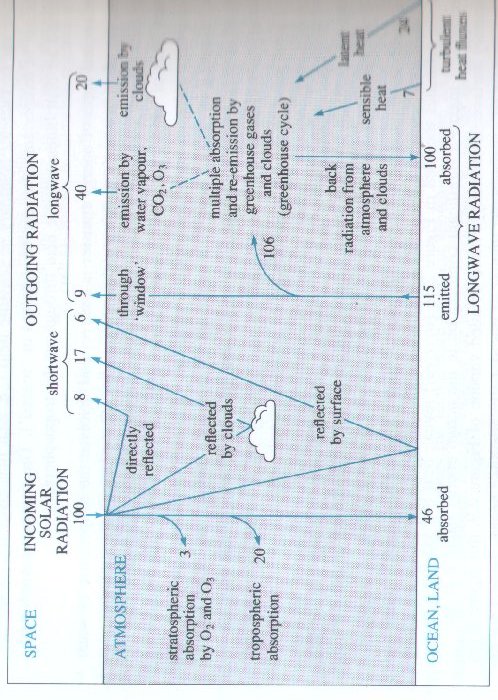
A proportion (the planetary albedo) of the shortwave solar radiation intercepted by the Earth is reflected directly back to space: the remainder is absorbed by the Earth-atmosphere system, the bulk of it at the Earth's surface.
Outgoing longwave radiation from the Earth's surface is repeatedly absorbed and re-emitted by molecules of certain trace constituents naturally present in the atmosphere - the greenhouse gases (mainly water vapour and carbon dioxide, but also ozone, methane and nitrous oxide): ultimately, it is re-radiated to space from higher, colder levels, thus maintaining an overall radiation balance at the top of the atmosphere. The 'trapping' of longwave radiation by greenhouse gases (and clouds) is the origin of the Earth's natural greenhouse effect: together with the turbulent mixing of the lower atmosphere (the troposphere) - and the consequent redistribution of sensible and latent heat - this keeps the planetary surface a vital 33 deg C warmer than it would otherwise be.
Important: You should be able to interpret a schematic representation of the global energy balance, like the one in Figure 2.14: Activity 2.3 is a good guide here.
(see image at end of summary)
The chemical and photochemical processes that maintain the ozone layer in the stratosphere both 'filter' out (potentially damaging) shorter uv wavelengths in the incoming solar radiation, and heat this region directly - whence the 'reversal' in the Earth's temperature profile at the tropopause. Stratospheric ozone also absorbs and re-emits outgoing longwave radiation.
The climate for any part of the Earth varies mainly with latitude and season. There is a net gain of radiant energy by the Earth-atmosphere system at low latitudes and a net loss of radiant energy at high latitudes. Clouds are important in the reflection of the incoming solar radiation back to space. The albedo of the Earth varies with latitude, being greater in the polar regions, due to the snow and ice cover. The albedo of land surfaces is usually greater than the ocean albedo. Heat from low latitudes is tranferred to high latitudes by winds and ocean currents.
Driven largely 'from below', the general circulation of the atmosphere results from the differential heating of the planet, coupled with its rotation: the net effect is to transport heat towards the poles. An important contribution to this heat transport comes from the transient 'weather systems' - cyclones and anticyclones - generated as instabilities in the general westerly flow at mid-latitudes. Elsewhere, the main surface wind systems are the trade winds (at low latitudes) and polar easterlies. Some surface winds - the monsoons - reverse direction seasonally.
Driven by the pattern of prevailing winds at the surface, the major current systems in the upper ocean make a significant contribution to the net transport of heat from low to high latitudes. Winds also produce turbulent mixing in the upper ocean - together with the downwelling of surface waters and upwelling of subsurface waters. The deep-water thermohaline circulation (which links the world's oceans together) is driven by the sinking of cold, saline water at high latitudes in winter.
The movement and storage of water around the world - the hydrological cycle (Figure 2.33) - is ultimately linked to the dynamics of the atmosphere and the global energy budget. Ultimately, it is driven by the solar energy used in the evaporation of water from the Earth's surface. Globally, this is the main process whereby heat is transferred to the atmosphere - released when water vapour subsequently condenses to form clouds, and falls as rain (or snow). Atmospheric moisture - and indeed freshwater availability in general - is highly variable, both in space and in time. Vegetation plays an important part in the regional hydrological cycle (through evapotranspiration) - as well as the surface energy balance - and hence in shaping the climate on this scale (Figure 2.34).
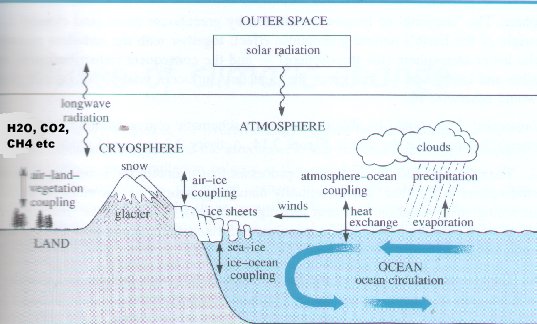
The pattern of climatic conditions around the world, and hence the geographical distribution of 'natural' vegetation (biomes, Figure 2.1) results from the workings of the whole interconnected climate system. This takes in the atmosphree, oceans, cryosphere, land surface and terrestrial vegetation - and all the many processes that link these 'components' together.
Important: Given a schematic representation of the climate system (like the one in Figure 2.35) you should be able to describe briefly the main links between the various components, as summarized in Sections 2.3.4 and 2.4.
Factors that can cause natural climatic change are: lithospheric plate movements, orbital variations, changes in the solar constant, volcanic acitivity and atmospheric composition.
Proxy data (indirect data) are used as a record of past climate.
The Earth's past climate has mainly been warmer than at present, but there have been cooler times, called Ice Ages, which last for 100 Ma or so. Within an Ice Age there are glacials (cold periods) and interglacials (warm periods). At the moment we are in an interglacial of the Quaternary Ice Age. The global-mean surface temperature change between glacials and interglacials is about 5 deg C. Glacials (and interglacials) occur about every 100ka within an Ice Age.
Plate movements affect climate on a long term-scale, hundreds of millions of years, and are thought to be the factor controlling whether the Earth is in its warm state or its Ice Age state.
Variations in the Earth's orbit produce seasonal and latutudinal changes in solar raidation. There are three types of orbital changes: eccentricity, tilt and precession. Their effects on climate are called the Milankovic-Croll effects. These effects are the triggering force for glacial and interglacial cycles.
Positive feedback effects amplify the Milankovic-Cross effects.
Solar irradiance (and hence the solar constant at Earth) has increased substantially during the lifetime of the Earth. On shorter time-scales, direct observations reveal small (less than 1%) changes in solar irradiance, in step with the 11-year sunspot cycle. Larger, century time-scale fluctuations in solar irradiance may be responsible for the series of global-scale 'Little Ice Age' type events during the present interglacial (the Holocene), but the evidence for such a link is both indirect, and 'highly suggestive', at best.
Large volcanic eruptions can reduce the global-mean surface temperature by up to 1 deg C for up to 3 years.
The composition of the atmosphere has changed significantly during the lifetime of the Earth, particularly with regard to carbon dioxide concentration, with the consequent change in the greenhouse effect.
On a glacial-interglacial time-scale, atmospheric carbon dioxide changes, which appear to be triggered by temperature changes, act to strongly amplify Milankovic-Cross effects on climate.
Over the past 200 years or so, a whole range of human activities (collected in the answer to Activity 4.6) have increased the atmospheric burden of greenhouse gases, both natural (ie CO2, CH4,, N2O and possibly tropospheric ozone) and unnatural (ie various halocarbons, paricularly the CFCs). for each gas, this buildup implies an imbalance between its sources and sinks.
Unlike the other greenhouse gases, CO2 is not destroyed via chemical or photochemical processes within the atmosphere. Rather it is circulated between various carbon reservoirs: on the decade-to-century time-scale, the 'active' reservoirs are the atmosphere, oceans and terrestrial ecosystems. At persent, slow transfer into the deep ocean is believed to be the principal sink for anthropogenic CO2, but existing ocean-atmosphere carbon-cycle models do not balance the 'excess-CO2 budget. As yet, such models do not incorporate any biological factors (in particular, the workings of the biological pump). Neither do they permit estimates to be made of any possible uptake by terrestrial ecosystems.
(Important: You should be able to interpret a diagrammatic representation of the global carbon cycle (like the one in Figure 4.19, say) and explain briefly the physical, chemical and/or biological controls over the various carbon fluxes, and the way human activities can interfere with these controls (as summarized in Activity 4.4).
Current understanding of the methane budget reveals a deficit (Activity 4.5), but whether this stems from an underestimate of methane emissions, or an overestimate of the atmospheric sink (through reaction with the OH. radical) is unclear.
Important: You should be aware of the range of human activities that can affect the atmospheric concentration of CH4, either directly (by increasing sources of CH4) or indirectly (by changing the atmospheric abundance of OH. radicals). Part (a) of Activity 4.6 is a good guide to the basic level of understanding required.
There is good evidence that anthropogenic sources of the key 'precursor' gases (ie partial combustion products in the presence of elevated levels of NOx) can produce a build up in tropospheric ozone on a local or regional scale. But truly global long-term trends are ill-defined as yet.
Industrially produced halocarbons may have chemical sinks in the lower atmosphere (if they contain H atoms), or photochemicalones in the stratosphere (if they do not, like the CFCs). The latter compounds have long atmospheric lifetimes.
Projecting future anthropogenic emissions of the various greenhouse gases (or its precursors, in the case of tropospheric ozone) is essentially a problem for social scientists: they tackle it by constructing emission scenarios (more on which in Chapter 7). The atmospheric concentrations of those gases with long atmospheric lifetimes (not only the CFCs and N2O, but also the 'special' case of CO2) will respond only slowly to attempts to curtail emissions.
Afterword
But there is also a more general message to take from this chapter. The life cycles of the various greenhouse gases are eloquent testimony to the web of interactions that binds together the 'total Earth system', with threads that reach down into the deepest ocean, and extend up into the stratosphere as well. Traditionally, scientists have carved up the study of this complex, interconnected system into their various disciplines. There are good reasons for this: different techniques and methodologies are appropriate for the study of different types of problem. But Nature herself is cavalier about such distinctions. A better understanding of the planetary system, and its response to human activities, is a truly interdisciplinary endeavour - a view captured in the description of the IGBP quoted in Section 4.1.
(continued on pages 107, 108)
In simple terms, anthropogenic greenhouse warming can be viewed as a two-stage process. An increase in the atmospheric burden of greenhouse gases constitutes a radiative forcing of the climate system, i.e. it disturbs the radiation balance at the top of the atmosphere. Global warming acts to restore the balance; the new equilibrium climate is characterized by a higher global-mean surface temperature (Ts).
The 'climate sensitivity' is commonly discussesd in terms of the equilibrium change in Ts in response to a doubling of the atmospheric concentration of CO2 (which translates into a radiative forcing of some 4 W m-2): this is given the symbol (triangle)T2x.
Depending on their sign, radiative feedback mechanisms can act to either increase or reduce the climate sensitivity. Important examples include water vapour feedback, snow-ice albedo feedback and cloud feedback. These feedbacks are a manifestation of the complex interactions between the atmosphere and the other components of the real climate system - the oceans, cryosphere, land surface and the vegetation that grows there.
General circulation models (GCMs) are powerful tools for simulating the behaviour of the climate system, and its response to the radiative forcing. Most current versions attempt to incorporate the interactions under point 3 above by coupling a dynamic model of the atmosphere (an AGCM) to an array of much cruder models at the planetary surface. At present, computational constraints impose a fairly coarse spatial resolution; small-scale processes are incorporated through parameterization techniques. Overall, existing GCMs contain oversimplified, approximate and incomplete descriptions of many important climatic processes; examples include cloud formation, precipitation, oceanic heat transport, sea-ice formation and many of the surface processes collected in Figure 5.7.
Nevertheless, validation studies generate confidence that such models can simulate important features of the Earth's present (and past) climate. Control runs do, however, reveal significant errors in the simulation of regional climates.
Equilibrium scenarios generated by different GCMs suggest that doubling the atmospheric concentration of CO2 (or its radiative equivalent in terms of the other greenhouse gases) would induce significant surface warming; the climate sensitivities produced lie in the range 1.5-4.5 deg C. Uncertainties about cloud feedback are thought to be a major factor in this wide range of estimates. All of the models assessed by the IPCC agree well with a recent observational determination of water vapour feedback.
Likewise, all equilibrium scenarios agree on certain large-scale features of the likely geographical distribution of greenhouse-gas induced climatic change, e.g. enhanced warming at high latitudes, especially in winter (linked to the snow-ice albedo feedback loop). But the detailed pattern of regional change (especially as regards precipitation and soil moisture) is markedly model dependent.
Early studies with an AGCM coupled to a dynamic ocean model (an OGCM) suggest that vertical mixing in the oceans which is neglected in simple mixed-layer models) could significantly delay the atmospheric response to an on-going increase in greenhouse gases, ie the 'realised' warming at any given time is less that the 'expected' equilibrium response to the prevailing radiative forcing. An important mechanism here appears to be the sequestering of 'excess' heat via the strong vertical pathways that 'feed' surface waters into the deep ocean at high latitudes. The existing simulations suggest that this may also suppress enhanced high-latitude warming during the time-evolving phase of climatic change.
Because the simulations referred to under point 8 are so computer-intensive, most existing assessments of the pace of climatic change have been based on studies with a much simpler type of climate model. Here, the 'excess' radiative heating effectively removed from the atmosphere-upper ocean system is computed by the type of ocean model still widely used to simulate the transfer of 'excess' CO2 into the deep ocean. The global warming induced by the 'residual' heating is determined by the prescribed climate sensitivity. The results of such studies will be discussed further in Chapters 6 and 7.
Carefully screened data from weather stations on land and ships at sea have been used to reconstruct variations in the Earth's annual-mean surface temperature over the past century. Along with marked variability (on yearly and decadal time-scales), the record reveals a real global warming (in the range 0.3-0.6 deg C) over this period. The upward trend has been both irregular, and somewhat different in the two hemispheres.
Detailed interpretation of the global warming to date - and hence convincing detection of the greenhouse signal - is frustrated by the lack of information about other possible causes of recent climatic change. These include other possible external 'forcing factors' (sustained changes in the solar constant, volcanic eruptions, a changing tropospheric burden of sulphate and other aerosols), together with the noise of internally-generated natural variability.
As yet, the difficulties under point 2 preclude a reliable empirical estimate of the climate sensitivity, triangle T2x. Further research and monitoring programmes may narrow the present uncertainties in the model-predicted range of values (ie 1.5-4.5deg C) - and in the pace and geographical distribution of climatic change, as well. But only in the medium-to-long term - and there are no guarantees (compare with the ozone story). It may also reveal surprises, not indicated by existing model-based scenarios.
Since the Second World Climate Conference in 1990, the prospect of greenhouse gas-induced climatic change is an item on the international political agenda. An important influence here (albeit not the only one) was undoubtedly the broad scientific consensus (embodied in the IPCC report) that a continuing buildup in greenhouse gases is a 'legitimate cause for concern' - the more so since most of the gases have long atmospheric liftimes.
For all the reasons listed here (and discussed in previous chapters), there are inherent uncertainties when it comes to forecasting the response of the planetary system to a continuing buildup of greenhouse gases. Like the long-running saga about CFCs, the public and political debate about climatic change has been, and will no doubt continue to be, played out against the backdrop of these uncertainties. The 'detection debate' of the late 1980s is just one example of the way such uncertainties can, indeed almost inevitably will, generate disputes within the scientific community. That is the stuff of scientific argument. But picked up - and often magnified and/or distorted - by the media, and by various opposing advocate groups, this conveys a very confusing message to the 'wider public'. Retain your scepticism, but try not to become too cynical.
Projecting future anthropogenic emissions of greenhouse gases is a difficult and inherently uncertain business. It is tackled by constructing emission scenarios, based on assumptions about the demographic, economic, social, technological and political factors that are likely to influence future release rates. In this context, "business as usual" (BaU) effectively implies a continuation of past and current trends - ie, it envisages a future in which few or no active steps are taken to curb greenhouse gas emissions.
On a BaU basis, the next century will see an ongoing increase in CO2 from fossil fule use - the primary driving force being the link between energy consumption and economic development, coupled with continuing population growth (especially in the developing world). Unchecked tropical deforestation would make a significant, but smaller, contribution to future CO2 emissions.
Strategies that would act to slow the growth in CO2 emissions include: (i) major improvements in the overall energy efficiency of different economies; (ii) a greater reliance on natural gas (which is less 'carbon-intensive' than coal) and all non-fossil fuel energy sources (hydroelectric, nuclear, biomass, solar and other renewables); and to a lesser extent (iii) efforts to slow, halt or even reverse tropical deforestation, and to promote afforestation programmes outside of the tropics. In practice, policies to curtail CO2 emissions will challenge countless established practices in the industrialised world, and the legitimate aspirations of less economically developed regions. Achieving effective controls will require concerted government action, at both the national and international level.
Important: You should be aware of the key issues involved here, as summarised in Activities 7.1 and 7.3.
A BaU future would be expected to generate a continuing increase in anthropogenic emissions of methane, especially those linked to crucial agricultural activities (ie rice cultivation and rearing livestock).
Note: Refer to Activity 7.4 for a summary of the key points here.
As noted in section 4.3.3, future emissions of ir-absorbing halocarbons (ie the CFCs and their likely substitutes) will be largely determined by the level of international compliance with the evolving provisions of the Montreal Protocol.
According to the IPCC's assessment in 1990, a BaU future would subject the planet to sustained - and ever increasing - greenhouse forcing throughout the next century: the total forcing could reach a value equivalent to a CO2-doubling by around 2020. Model simulations indicate that this forcing scenario could induce global warming at an unprecedented rate - the current 'best estimate' being around 0.3 deg C per decade (with an uncertainty range of 0.2-0.45 deg C). The more urgent and concerted the measures taken to curb greenhouse gas emissions (especially of those gases with long atmospheric lifetimes, notably CO2 and the CFCs), the slower and less marked anthropogenic greenhouse warming is likely to be: that is the essence of the precautionary principle.
Important: Given a diagram like the one in Figure 7.1, you should be able to put together a critical appraisal of the layers of modelling studies involved - and hence explain briefly why the '"what if?' global warming scenarios generated in this way can only be indicative of the risks incurred by following various courses of action. The key points here were identified in Activity 7.5 and taken up in the text that followed it in SEction 7.2.
Existing modelling studies (referred to in point 6 above) do not capture the full 'interconnectedness' of the real planetary system. In particular, they cannot simulate:
- the possible climatic effects of ozone depletion;
- possible climate-related greenhouse gas feedbacks, comparable to those that apparently operated during major natural climatic changes in the past (ie glacial-interglacial transitions)
- possible interactions within the ocean-atmosphere system that could trigger the kind of abrupt - not smooth - changes in climate for which there is evidence in the palaeoclimatic record (eg the onset, and abrupt end, of the Younger Dryas).
More generally, the 'current state of knowledge' cannot rule out the possibility that continued greenhouse forcing could induce presently unsuspected responses within the planetary system. Surprises could well be in store - adding another element of uncertainty to existing assessments of what a BaU future might be like.
There are many problems involved in estimating whether, and by how much, global-mean sea-level has risen over the last 100 years. The best estimate is that the average rate of sea-level rise over the last 100 years is 1.0-2.0 mm yr-1 (10-20cm in 100 years). There is no firm evidence for an acceleration in the rate of sea-level rise over the last century.
Causes of the rise in the sea-level in the last 100 years are the thermal expansion of the oceans, melting of glaciers and small ice-caps, melting of the Greenland ice-sheet, and changes in the Antarctic ice-sheet. There are large uncertainties in the estimated contributions of each to the rise in sea-level. Most of the rise is caused by thermal expansion of the oceans and melting of glaciers and small ice-caps.
Future changes to the sea-level can be modelled using the IPCC scenarios. For the Business as Usual scenario, the best estimate for 2100 is the rise of 66 cm. Most of this comes from thermal expansion of the oceans, and melting of glaciers and small ice-caps. The West Antarctica ice-sheet is potentially unstable, but is unlikely to disintegrate and contribute to the rise in sea-level within the next century. The IPCC policy scenarios B, C and D project rises in the sea-level about one-third lower than the BaU scenario.
Even with a substantial stabilization or decrease in the emission of greenhouse gases, there will inevitably be future increases of temperature and, consequently, a further rise in sea-level due to slow reponse times to the causes of sea-level rise.
The rate of the rise in sea-level predicted for the next 100 years on the BaU scenario is about four times faster than over the last 100 years.
The predicted rise in sea-level would have major global consequences; cities, croplands, coastal environments and even entire nations would be flooded.
Raised CO2 levels increase net photosynthesis, most noticeably in C3 plants. Many tropical crops of economic importance to developing countries, eg maize and sugar cane are C4 plants, which are less affected by raised CO2
levels.
A CO2-fertilization effect is usually evident in most plants grown in high CO2
under ideal conditions, but such increased photosynthesis is (i) not universal and (ii) often transitory, and (iii) often outweighed by reductions in soil moisture content or mineral nutrients.
Increased temperatures may or may not increase net photosynthesis, depending on the species. Changes in temperature have diverse and far-reaching effects on plant growth and reproduction, and therefore on the yields of important crops such as wheat. The success and geographical range of plants are strongly influenced by mean surface temperature.
Future increases in temperature are likely to benefit insect and fungal pests, with detrimental effects on crops, farm animals and humans.
Stomatal closure, triggered by high CO2 levels, restricts transpiration and thereby conserves water. The ability of some plants to withstand semi-arid conditions is therefore enhanced by a CO2-rich atmosphere, because water is used more efficiently, at least temporarily. However, the long-term effects are likely to be detrimental.
Growth (and yield) of some important crops is limited by temperature. At low latitudes, the major constraint is more likely to be soil moisture, suggesting that any future changes in temperature or in precipitation at the regional level will strongly influence productivity.
Because of uncertainty about the scale, pace and geographical distribution of any future changes in climate, predictions about impacts upon plants and animals are difficult, both in natural ecosystems and in agriculture.
Present-day natural communities of plants and animals are in a constant state of change and their composition is often strongly influenced by climatic factors. The geographical limits of many plants and animals are determined by temperature, for example the northern boundary of many insects in the UK. Such species are likely to expand their range in the event of global warming.
In a warmer climate, some species would fare better than others: species able to migrate only slowly into new territories would be disadvantaged as existing locations became unsuitable.
A northward spatial shift in European agricultural potential is predicted. For example, the northern boundary for successful grain maize cultivation is likely to shift by between 200 and 400 km for each 1 deg C warming. Southern areas of Europe may become less productive, largely because of lower soil moisture. In the UK, a warmer climate would provide opportunities for novel crops (in part because of the longer growing season) and yields would increase for some existing crops.
Equilibrium GCMs suggest that a doubling of CO2 would, at the regional level, result in expansions and/or shifts in suitable growing zones and there would be very significant dislocation of existing agricultural practices.
The most authoritative estimates of the impact of global warming on a global scale foresee an overall reduction in food production and an increase in food costs, increasing the risk of major famines in the developing countries, and substantial economic damage to the developed world.
There are broadly three different ways of responding to the threat of climatic change: technical fixes, adaptation, and preventive action.
A technical fix would aim to counteract climatic change by deliberately engineering modifications to the environment, but those proposed are typically either impractical or very risky, with uncertain side-effects, and are likely to lead to legal or political conflicts.
Most adaptive responses are expensive and unable to prevent serious economic, human and environmental costs. The most efficient strategies probably involve early investment to increase adaptability and reduce vulnerability to uncertain climatic changes. Many developing states would not have the capital resources to adapt to most changes, and are therefore vulnerable. Resulting mass migration, political instabilities and conflicts would affect all states.
For these reasons, the international community has declared itself in favour of concentrating on preventative strategies. The Framework Convention on Climate Change (FCCC) established basic principles and objectives, and agreed a legal and institutional framework within which subsequent agreements detailing specific and substantial obligations can be negotiated and reviewed. The flexibility and relatively weak commitments of the FCCC allowed an agreement to be reached; more ambitious negotiations would probably have been blocked.
A key element of the FCCC is that states can choose what measures to adopt in order to limit greenhouse gas emissions. However, they must not only provide annual national inventories of their emissions, but also regularly report on and develop the substance and implementation of these measures. An international review process would monitor implementation and hopefully would increase political pressures on governments to make substantial commitments and to honour them.
Science and 'expert knowledge' enters and shapes international policy-making through this review process, as well as through its influence on individual governments, companies, interest groups and public opinion. The relationship between science and policy-making is complex, and popular images of it are typically misleading or wrong.
Verification issues are important for the effectiveness of the developing climate convention. Unless national commitments are adequately verifiable, states may be tempted to set vague objectives or to implement them inadequately, and suspicions of non-compliance by some states could undermine the climate convention. Technical constraints on monitoring capabilities, and the varying availability of appropriate reliablr statistics, mean that some commitments are more amenable to verification than others. States' carbon dioxide emissions from the burning of fossil fuels could be reasonably accurately calculated, using national energy statistics and data on the fuels and the combustion process. Limits on emissions due to deforestation or changes in land use would be hard to verify, whereas commitments relating to areas of forest of a given type could be monitored using a combination of remote sensing and ground observation.
Once global targets for limiting greenhouse gas emissions are agreed, it will be necessary to negotiate an arrangement for dividing the burden of achieving these targets that all states would find acceptable. Potential approaches include; requiring each state to make equal percentage reductions (perhaps with different reductions for developed and developing states); allocating emission quotas on a per capita of population basis; or negotiating different limits for each state on the basis of equality of burden, levels of development or degrees of responsibility for the problem.
There are strong arguments in favour of each of these approaches, but each would pose great negotiating challenges. Nevertheless, initial substantial constraints will have to be agreed soon at least to limit the rate of climatic change and to reduce the scale of the damage associated with it. Such measures could give human societies and natural ecosystems more time to adapt, and make it possible for future generations to return atmospheric concentrations of greenhouse gases to present levels by the end of the 21st century. This will require sustained and profound change throughout human society.
Back to S280